
Direct answers
| Question | Short answer | Source and year |
|---|---|---|
| How big is direct selling worldwide? | About $163.9 billion in retail sales | WFDSA, 2024 |
| How many independent representatives worldwide? | 104.3 million (up 0.1% from 2023) | WFDSA, 2024 |
| What share of the global sales force is women? | 72.1% | WFDSA, 2024 |
| How big is the US market? | $34.74 billion (constant 2024 USD) | WFDSA, 2024 |
| How big is the US market (later US study)? | About $34.2 billion | DSEF, 2025 data (2026 study) |
| How many US direct sellers? | 12.18 million independent representatives (WFDSA, 2024). Separately, 5.2 million direct sellers who build a business (DSEF, 2025). These are different definitions. See below. | WFDSA, 2024; DSEF, 2025 |
| What share of US sellers are women? | About 73% (WFDSA table and DSEF both round to 73%) | WFDSA, 2024; DSEF, 2025 |
| What share of sales is party plan? | No current global or US party-plan share appears in the WFDSA 2024 STATS report or the DSEF 2026 Growth & Outlook materials used for this page. Older DSA platform-share figures (for example 2008 to 2013) are out of date and are not used here. | WFDSA STATS 2024-2025; DSEF 2026 |
Why the US figures differ
Why the two US sales figures differ: WFDSA reports 2024 US retail sales of $34.74 billion in constant 2024 USD. The Direct Selling Education Foundation (DSEF) reports 2025 US retail sales of about $34.2 billion. They are different years and different study methods, so they should be labeled and read side by side, not merged into one number.
Why the two US seller counts differ: WFDSA's 12.18 million (2024) counts independent representatives, a wide group that can include business builders and people who mainly buy at a discount. DSEF's 5.2 million (2025) counts direct sellers who work to build a business (0.4 million full-time and 4.8 million part-time). The DSEF fact sheet also notes that 11.6 million people in the US had signed or renewed independent contractor sales agreements in 2025, of whom 5.2 million were direct sellers and 6.4 million were discount buyers. That wider agreement count is closer in size to WFDSA's representative total, which is why the headline seller numbers look far apart.
Sourced snapshot
Figures below are retail sales unless noted. Dollar amounts from WFDSA are constant 2024 USD, estimated retail sales excluding VAT.
| Measure | Figure | Year | Source |
|---|---|---|---|
| Global retail sales | ~$163.9 billion (essentially flat, about -0.05% vs 2023) | 2024 | WFDSA Global Statistics; WFDSA STATS Report |
| Global independent representatives | 104.3 million (+0.1%) | 2024 | WFDSA |
| Women in global sales force | 72.1% | 2024 | WFDSA |
| Representatives under 35 | about 23% (18-24: 6.9%; 25-34: 16.4%) | 2024 | WFDSA |
| Representatives 55 and older | about 28% (55-64: 18.1%; 65+: 10.3%) | 2024 | WFDSA |
| Share of markets that grew | 45% | 2024 | WFDSA |
| Markets with $1B+ sales | 21 markets, 92% of global sales | 2024 | WFDSA |
| Regional sales share | Asia/Pacific 40.3%; Americas 37.3%; Europe 21.6%; Africa/Middle East 0.08% | 2024 | WFDSA |
| Leading product sectors (global) | Wellness; cosmetics and personal care; household goods and durables | 2024 | WFDSA |
| Global product mix (selected) | Wellness 29%; cosmetics and personal care 23%; household goods and durables 15% | 2024 | WFDSA STATS Report |
| US retail sales | $34.74 billion (-5.2%); about 21.2% of global sales | 2024 | WFDSA |
| US independent representatives | 12.18 million (-6.2%); women about 73% | 2024 | WFDSA STATS Report |
| US retail sales (DSEF) | ~$34.2 billion | 2025 | DSEF 2026 Growth & Outlook |
| US direct sellers (DSEF) | 5.2 million (4.8M part-time, 0.4M full-time); 73% female | 2025 | DSEF |
| US customers (preferred + discount) | 34.8 million | 2025 | DSEF |
| Average retail sales per DSEF direct seller | $6,577 | 2025 | DSEF fact sheet |
| Germany retail sales | $19.05 billion (-3.7% local); 907,634 representatives | 2024 | WFDSA |
| South Korea retail sales | $15.07 billion (-3.5% local); 8.09 million representatives; women about 79% | 2024 | WFDSA |
| Malaysia retail sales | $10.20 billion (+2.1% local); 9.61 million representatives; women 60% | 2024 | WFDSA |
| Brazil retail sales | $7.84 billion (+6.3% local); 2.75 million representatives; women 85% | 2024 | WFDSA |
Top 10 markets by 2024 retail sales (WFDSA): United States, Germany, China, Korea, Malaysia, Japan, Brazil, Mexico, France, Taiwan.
What these numbers mean for party plan
Party plan (shows, host rewards, in-home or live virtual gatherings) sits inside the wider direct selling channel. It is not the whole channel.
- WFDSA's 2024 report and DSEF's 2026 study do not publish a current party-plan share of sales. This page does not invent one.
- For party-plan product categories, the closest public slices are product groups that often show up at parties (wellness, cosmetics and personal care, household goods, clothing, home care). Exact fit varies by company and market. In the US, WFDSA's 2024 product mix also includes large non-party slices such as financial services (about 16%) and utilities (about 7%), so the full US total is broader than a typical party-plan catalog.
- DSEF's 2025 US picture is mostly part-time (4.8 million of 5.2 million direct sellers). Programs built around a few hours a week, clear host rewards, and simple ordering match that shape better than full-time-only pitches.
- The global field is aging: representatives under 35 fell to about 23% in 2024, while those 55 and older rose to about 28% (WFDSA). Host rewards and show formats that work for older hosts, and that still bring in younger hosts, both matter.
- Related reading on format and rewards (no earnings claims): Hostess rewards 101, In-person orders and the party-plan resurgence, Virtual vs in-home, What is party plan.
Common questions
How big is the direct selling industry worldwide?
About $163.9 billion in estimated retail sales in 2024, essentially flat versus 2023 (about -0.05%), according to the World Federation of Direct Selling Associations (WFDSA). Independent representatives numbered 104.3 million.
How big is direct selling in the United States?
Use two labeled figures:
- WFDSA, 2024: $34.74 billion in constant 2024 USD, down 5.2% from 2023. The US was about 21.2% of global sales and ranked first worldwide.
- DSEF, 2025 (2026 Growth & Outlook Study): about $34.2 billion in US retail sales.
Do not average them. Cite the year and the source for whichever figure you use.
How many people sell in direct selling?
- Worldwide (WFDSA, 2024): 104.3 million independent representatives.
- United States (WFDSA, 2024): 12.18 million independent representatives.
- United States (DSEF, 2025): 5.2 million direct sellers who build a business (plus a wider pool of signed independent contractor agreements and discount buyers described in the DSEF fact sheet).
Always say which definition you are using.
What percentage of direct sellers are women?
- Global (WFDSA, 2024): 72.1% of the sales force. That is below the 2019 level of 73.8%.
- United States: about 73% in both the WFDSA 2024 country table and the DSEF 2025 study.
- Country examples (WFDSA, 2024): Brazil 85%, Korea about 79%, Malaysia 60%. Germany's live market page on Party Plan Solutions lists 52% (WFDSA Statistical Database, gender for DSA member companies).
Which countries are the largest direct selling markets?
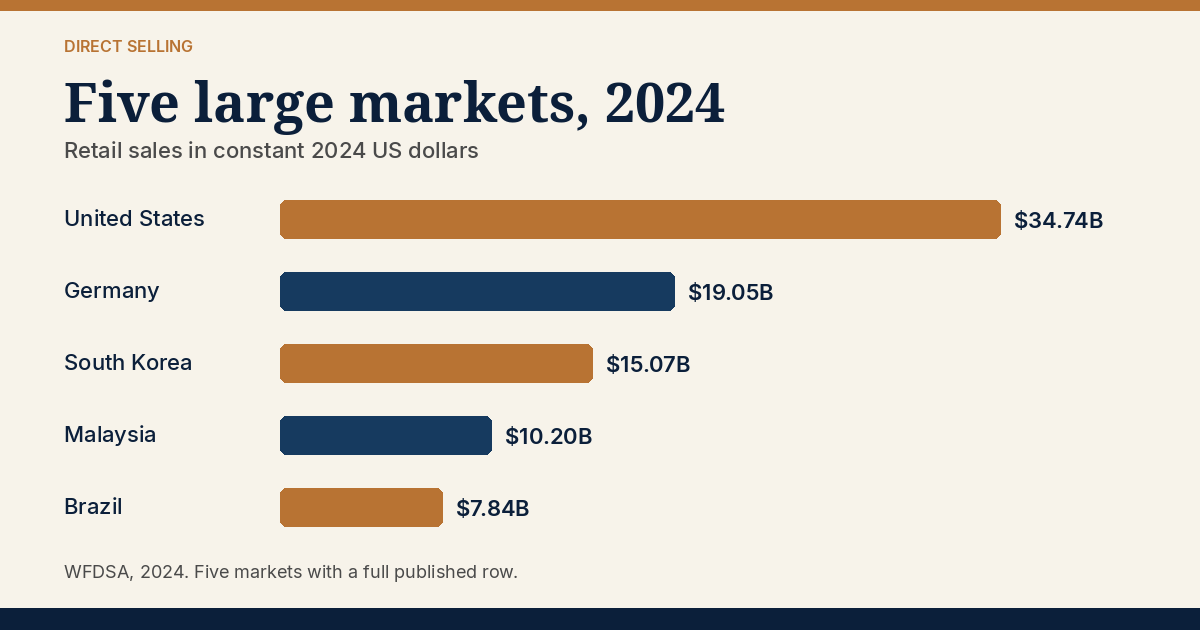
Per WFDSA 2024 retail sales (constant USD), the top five with full rows published on Party Plan Solutions are:
- United States: $34.74B, 12.18M representatives
- Germany: $19.05B, 907,634 representatives
- South Korea: $15.07B, 8.09M representatives
- Malaysia: $10.20B, 9.61M representatives
- Brazil: $7.84B, 2.75M representatives
China and Japan also rank in WFDSA's global top 10. Party Plan Solutions only publishes a country page when WFDSA reports a full row (sales, representatives, growth, product mix, and gender), so China and Japan are not on the markets hub yet.
Is the industry growing or shrinking?
In 2024, WFDSA described global sales as essentially flat after declines in 2022 and 2023. 45% of markets grew (up from 23% in 2022 and 42% in 2023). Average market growth improved to 4.6% in 2024. The US still shrank in 2024 on WFDSA's measure (-5.2%). Brazil (+6.3% local) and Malaysia (+2.1% local) grew among the large markets covered here.
What share of direct selling is party plan?
Unknown from current WFDSA and DSEF releases used here. Those reports do not break out a current party-plan or group-sales share of channel sales. Older DSA platform-share numbers from more than a decade ago are not repeated on this page as if they were current. For how party plan works as a model, see What is party plan and Party plan vs other models.
Where do these statistics come from?
- WFDSA compiles national association research into global and country retail sales, representative counts, and related measures. Sales are estimated retail excluding VAT, converted to constant USD for the data year.
- DSEF (with DSA) publishes the US Growth & Outlook Study, independently audited, focused on US retail sales, sellers, and customers.
- Figures can be restated in later releases. Always keep the as-of year on the number.
Country pages and related guides
Markets hub and country data (WFDSA 2024)
Industry notes
Related guides
- Distributor income since COVID: what the numbers show
- In-person orders and the party-plan resurgence
- Hostess rewards 101
- Anatomy of a party-plan compensation plan
- Virtual vs in-home
- What is party plan
- Party plan vs other models
Primary sources
- WFDSA Global Statistics
- WFDSA STATS Report 2024-2025 (PDF)
- DSEF 2026 Growth & Outlook Study
- DSEF/DSA US fact sheet (PDF)
Note
Figures are as published by WFDSA, DSEF, and the national associations behind them, for the years named, and may be restated in later releases. WFDSA converts local currency to constant US dollars for the data year, so dollar totals can differ from local reports. This page is general information about market size and structure. It is not financial, legal, or business advice, and it does not describe what any person will earn. Starting or joining a direct selling business carries risk, and results vary. For company-level income pictures, read that company's own income disclosure statement.